
46.92 | 8.60

Expert
If you notice any outdated information:
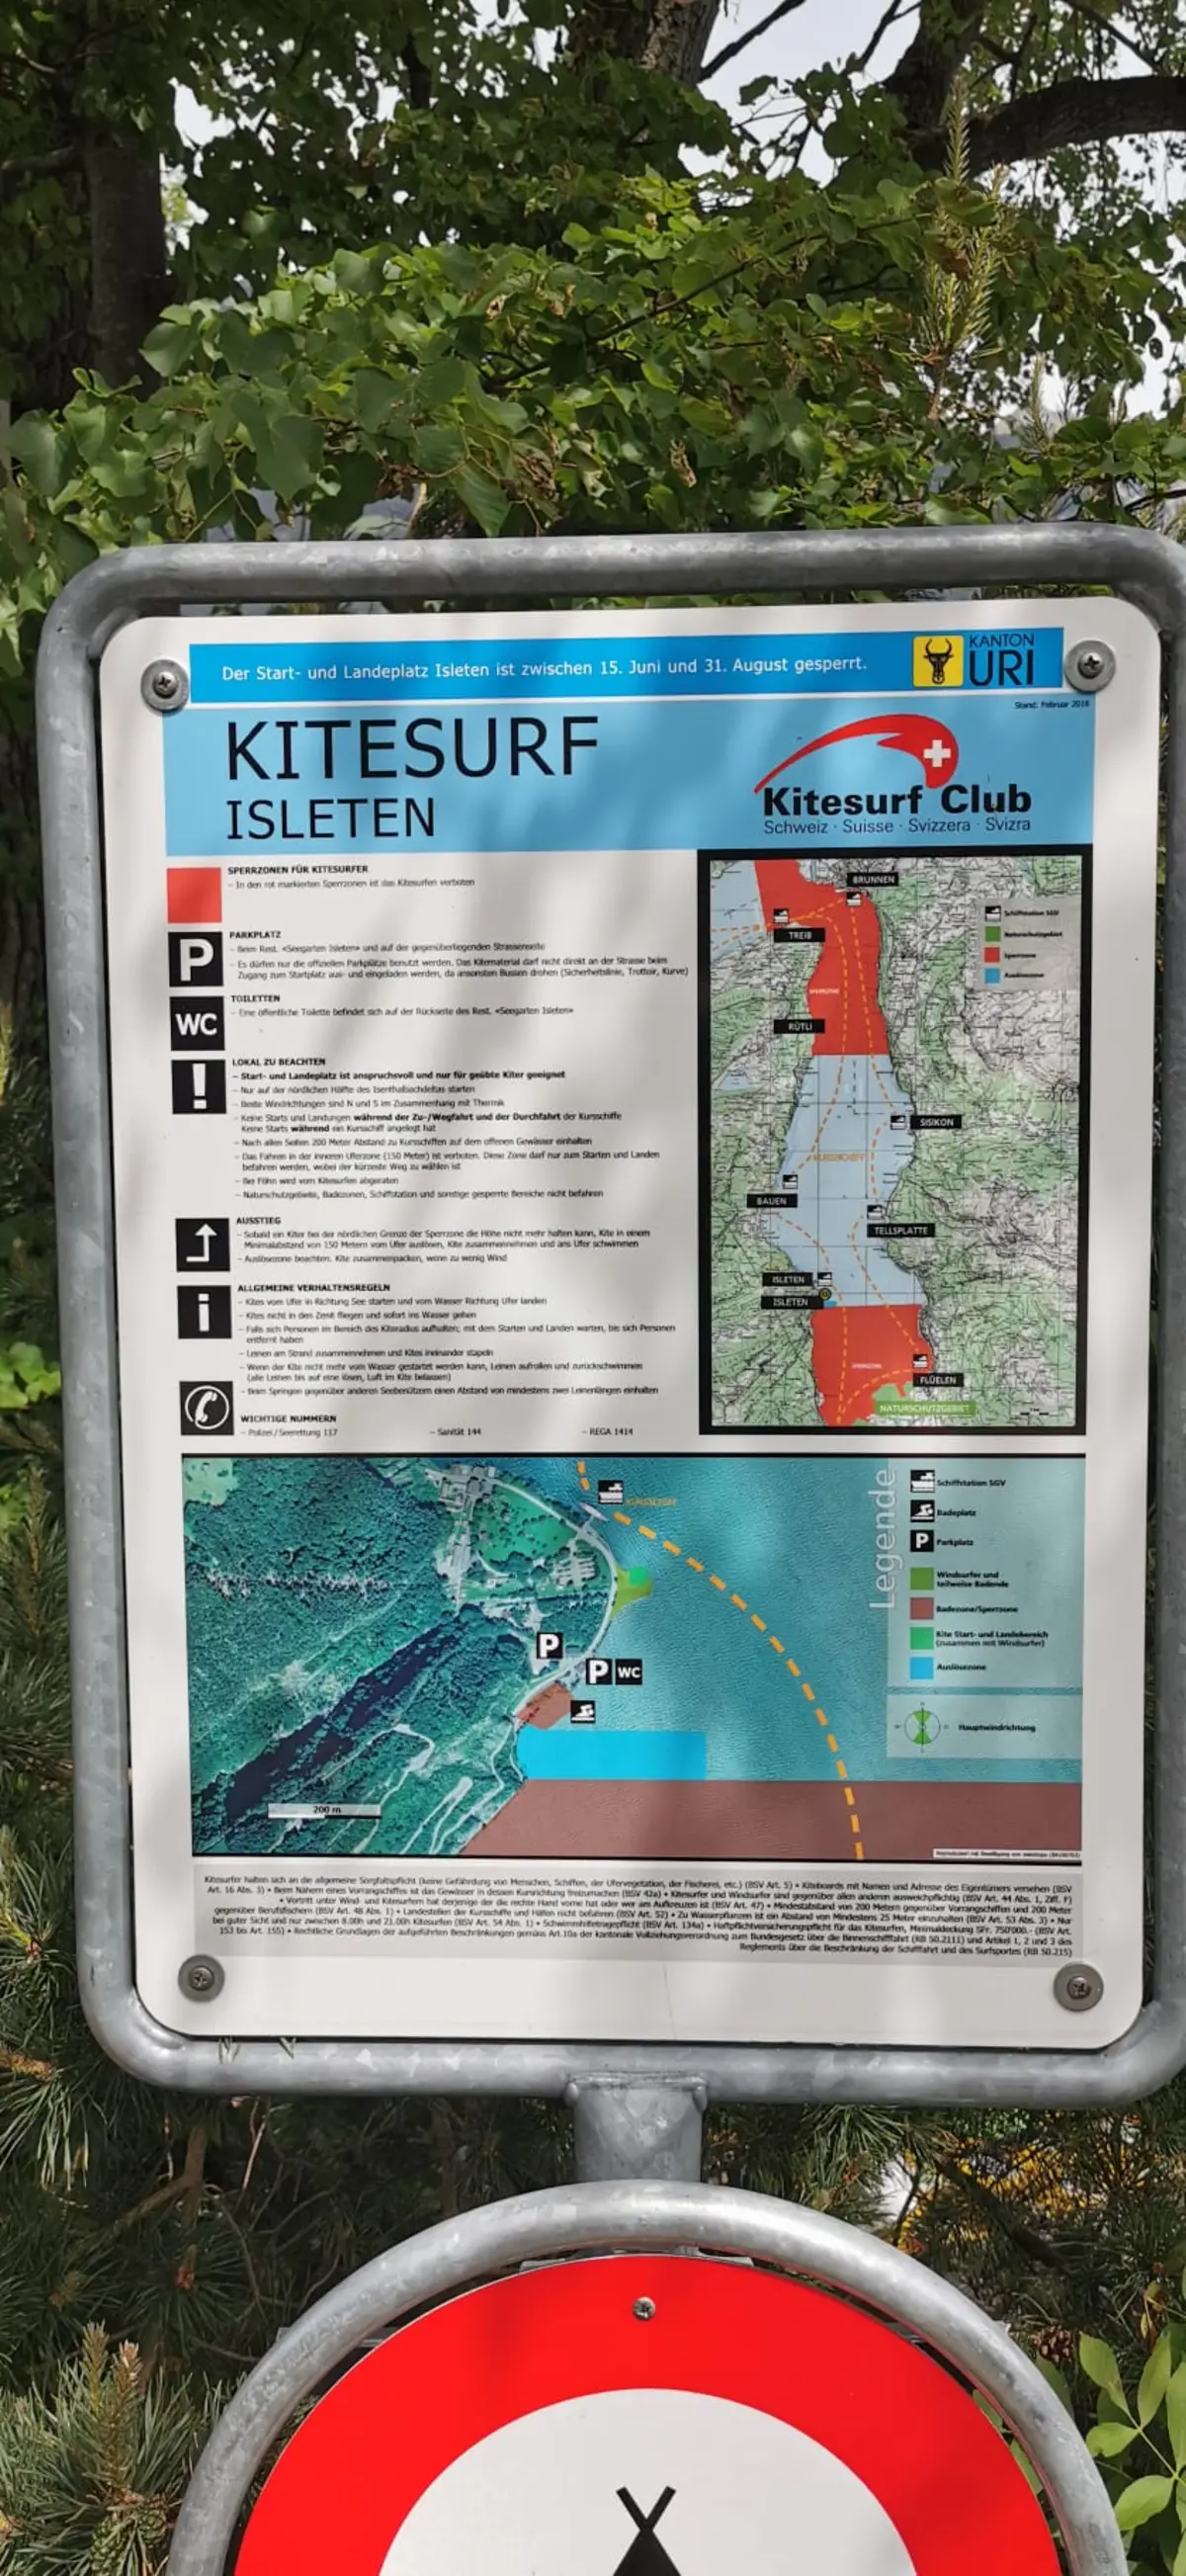
Suggest an editThis chart shows the probability of Foehn in the Swiss Alpine valleys. It is based on the pressure differential between Zurich and Lugano based on the Open Meteo model (Icon-EU).
Live data from Isleten Bachdelta weather station (wind, gusts, history) is reserved for Premium members.
Already a Premium member? Log in
Loading webcams...
Comments 0
Login to commentNo comments yet.